

Toronto and GTA home sales in July are shaping up to be slower than in June.
While the first two weeks of home sales in July appear to be on a weaker track than in June for the Greater Toronto Area housing market, sales are showing some year-over-year improvement across most home types throughout the region.
READ: How Much You Need To Earn To Afford A Home In These GTA Cities
The big pictures shows home sales fell two and three per cent within the City of Toronto and total TREB area from the same time period in 2017. Declines from last month are more pronounced, with 20 per cent and 21 per cent fewer activity in both regions, respectively.
March and May were slow for GTA home sales, then June picked up some of that slack. But now that the dog days of summer are on us, it's not surprising that July has slowed.
It's typically at this time of year that both buyers and sellers take a break before conditions heat back up come fall.
This is reflected in the shorter supply in new homes for sale across all home types, as fewer sellers wish to put their listing on the market as cottage country calls.
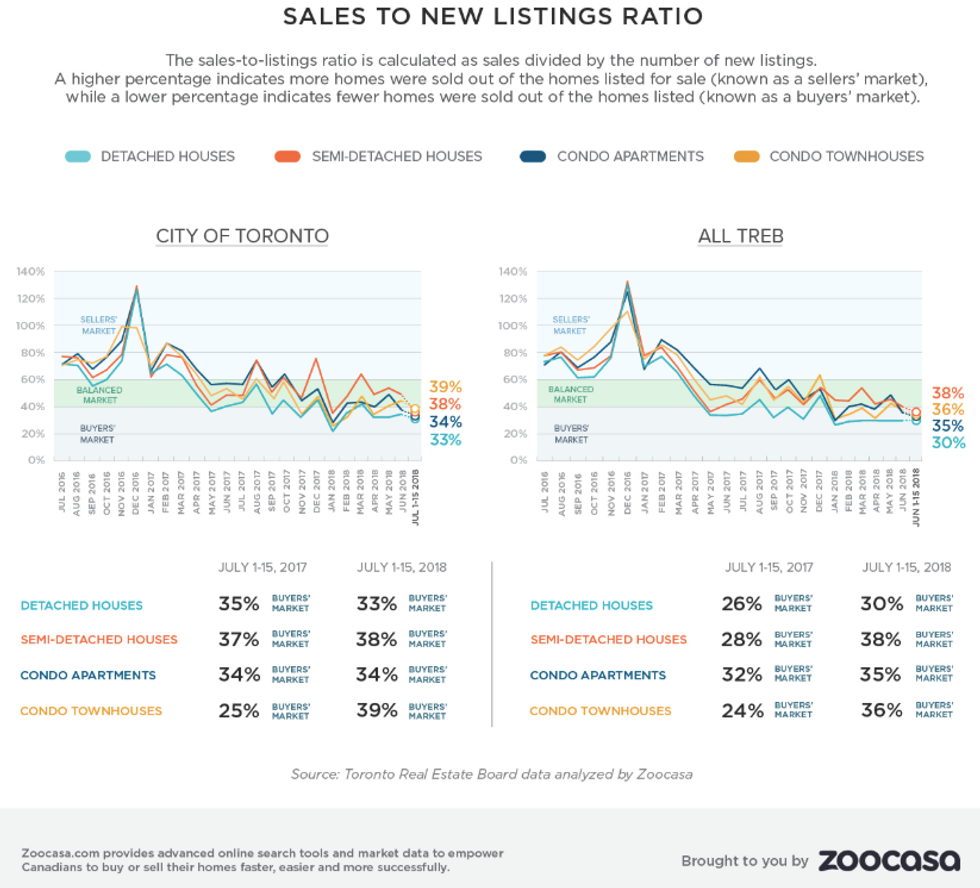
As Zoocasa's infographic analysis shows, both the 416 and GTA regions reflect buyers’ market conditions, with sales-to-new-listings ratios ranging from 30 to 38 per cent.
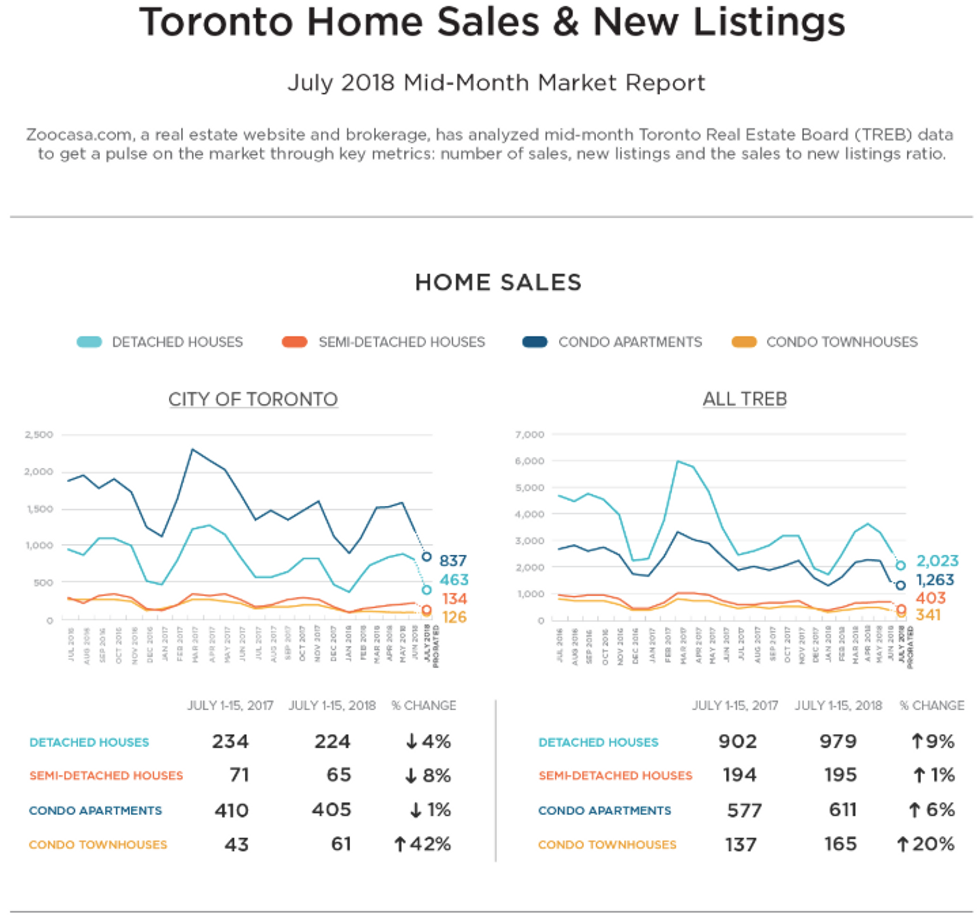
Main takeaways from Zoocasa's analysis:
- Condo apartments: Sales are slightly one per cent down in the City of Toronto (405 vs. 410 last year) and up six per cent across the GTA (611 sales vs 577 last year).
- Condo townhouses: Sales are up 20 per cent in the City of Toronto (61 vs. 43 last year) and up 20 per cent across the GTA (165 sales vs 137 last year).
- Detached houses: Sales dropped four per cent in the City of Toronto (224 vs. 234 last year), while increasing nine per cent in the GTA (979 vs. 902 last year).
- Semi-detached houses: Sales dropped eight per cent in the City of Toronto (65 vs. 71 last year) and edged up one per cent in the GTA (195 vs. 194 last year).
(The above is a comparison between TREB market data from July 1-15, 2018 and July 1-15, 2017.)