The Greater Toronto Area housing market has long been defined by its supply and demand imbalance. The fact that there are simply too few available listings to keep pace with sales has been a culprit behind steep price increases and speculative activity within the marketplace.
It was this dynamic that policymakers sought to address when they introduced both the Ontario Fair Housing Plan as well as the federal mortgage stress test. And, while these measures proved to have an impact in the short term, it appears their effectiveness may be waning as the same fundamentals are alive and well once again, according to the June numbers released by the Toronto Real Estate Board.
READ: Only 1 In 5 Families Can Afford A Toronto Home Due To High Prices
“Buyers started moving off the sidelines in the spring, as evidenced by strong year-over-year price growth throughout the second quarter,” says Jason Mercer, TREB’s chief market analyst. “However, because we saw virtually no change in the number of new listings, market conditions tightened and price growth picked up, especially for more higher-density home types, which, on average, are less expensive than traditional detached houses and therefore provide more affordable housing options under the new stress test regime.”
Sales Up By Double Digits In GTA
The data reveals a total of 8,860 transactions occurred over the month of June, up 10.4 per cent year over year. New listings, however, remained flat with 15,816 homes brought to market, down 0.3 per cent.
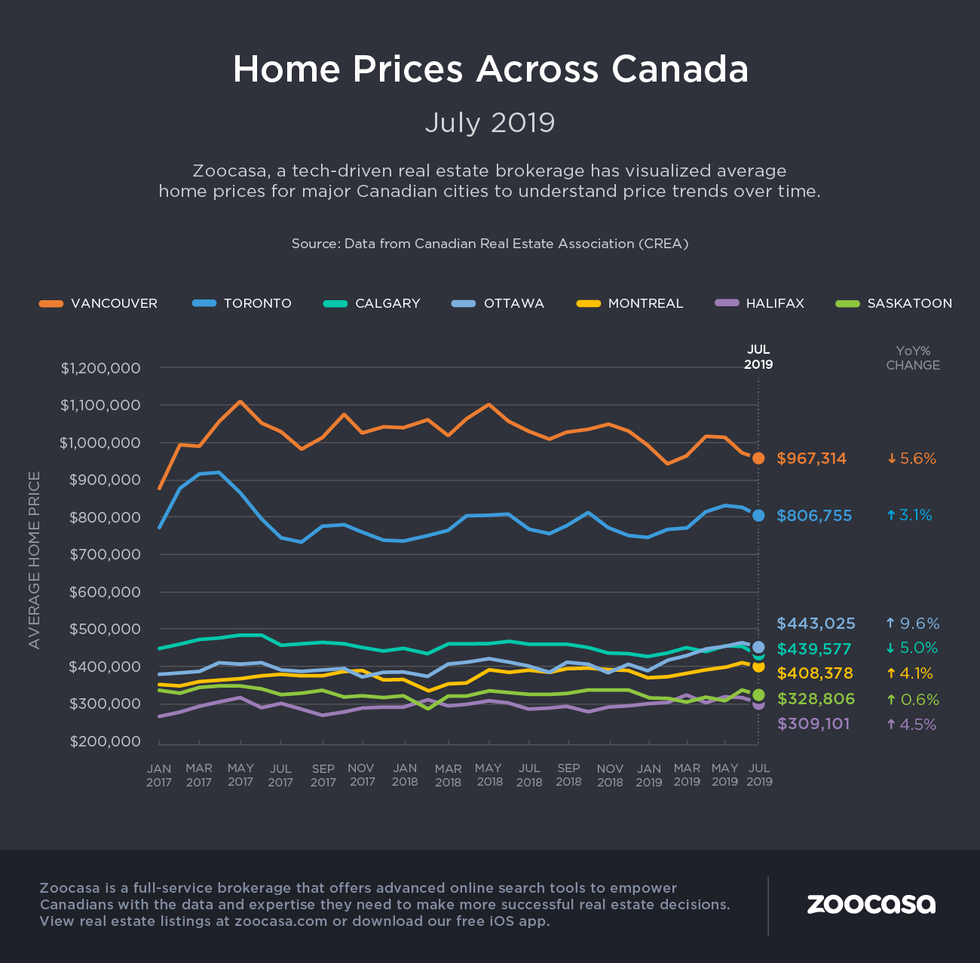
That’s resulted in a steady increase in the average home price, which rose 3 per cent to $832,703 compared to the same time last year. The MLS Home Price Index, which measures the value of homes sold, also rose by 3.6 per cent. Multi-family and “high-density” housing types, such as condos and townhouses, drove the bulk of the appreciation.
High-Density Home Types In Greatest Demand
These home types, which traditionally offer a less expensive entry point to the market, have been growing in popularity as GTA home prices have risen steeply over the past five years, and affordability has been further chopped by the stress test. However, this is leading to additional supply imbalances, as homeowners are remaining in their starter homes for much longer, as they remain priced out of the upper echelons of the single-family home market.
READ: Toronto Needs Missing Middle Housing Now More Than Ever
“While some home buyers may have adjusted to the OSFI stress test by looking to more affordable housing options, this could present an issue over the longer term because we aren’t adding a meaningful amount of new mid-density housing supply to bridge the gap between condominium apartments and detached homes,” said John DiMichele, TREB’s CEO.
“Finding ways to add more mid-density housing types to existing neighbourhoods and new developments needs to be a key component of municipal, provincial, and federal housing plans and policies moving forward.”
Sales Strongest Throughout 905 Housing Markets
Markets located within the 905 regions saw the largest pace of sales growth; a total of 5,659 homes traded hands outside the City of Toronto, marking a 14.3 per cent year-over-year increase. Combined with a small dip in new listings by -2.2 per cent, that’s pushed prices up by 2.1 per cent to an average of $785,879.
READ: 3 Home Buying Trends To Keep An Eye On In 2019
Growth varied across different municipalities; for example, Mississauga real estate sales rose just 2.5 per cent, but that was more than enough to outpace an -8.6 per cent decline in new listings, putting additional pressure on buyers in the popular GTA suburb. Demand was highest in more affordable pockets within Ontario’s Greater Golden Horseshoe – performance among Burlington homes for sale rose 6.7 per cent with the average price rising 2.6 per cent to $802,275. In contrast, pricier Oakville homes for sale saw just 2.6 per cent growth in sales and a 0.1 per cent in prices to an average of $1,072,135.
The average price within the 416 proper, however, is approaching the million-mark at $915,481, a 5.1 per cent increase. Overall sales growth rose at a more moderate pace of 4.1 per cent with a total of 3,201 transactions.
Check out the infographic below to see how sales and price trends have changed year over year in the City of Toronto in June: