Toronto condo prices exploded in recent years, and even today in an environment of cooling home prices the city’s high-rise market is still appreciating.
But citywide numbers, such as monthly resale figures provided by the Toronto Real Estate Board and new-home market reports care of the Building Industry and Land Development Industry, don’t tell the whole story.
To get a better idea of how the condo market has been developing, Storeys asked BuzzBuzzHome, which collects data on new condo projects across North America, how pricing has evolved in popular neighbourhoods over the past several years.
BuzzBuzzHome provided average list prices and median pricing per square foot for 10 neighbourhoods from the first quarter of 2014 and the same period this year.
Neighbourhoods were selected based on which yielded the most comprehensive data to begin with. The asking prices were acquired from the builders and visits to sales centres.
While the numbers only show what builders were listing available units for at the time, Suleman Dawood, a BuzzBuzzHome research analyst, suggests they provide broader insights into local markets.
“That’s just generally a good indication of sales and activity,” Dawood says of the numbers.
Here’s how 10 of the most popular Toronto neighbourhoods for condo buyers have performed since 2014.
Davisville Village
Average list price: $751,009
Increase since Q1 2014: +29.55%
Median price per square foot: $977
Increase since Q1: 2014: +46.09
 Art Shoppe Condos
Forest Hill
Average Q1 2018 list price: $718,441
Increase since Q1 2014: +37.81%
Median price per square foot: $1,400
Increase since Q1 2014: +117.69%
Fort York
Average Q1 2018 list price: $521,251
Increase since Q1 2014: +34.42%
Median price per square foot: $831
Increase since Q1 2014: +62.49
Entertainment District
Average list price: $849,718
Increase since Q1 2014: +66.97%
Median price per square foot: $985
Increase since Q1 2014: +59.07%
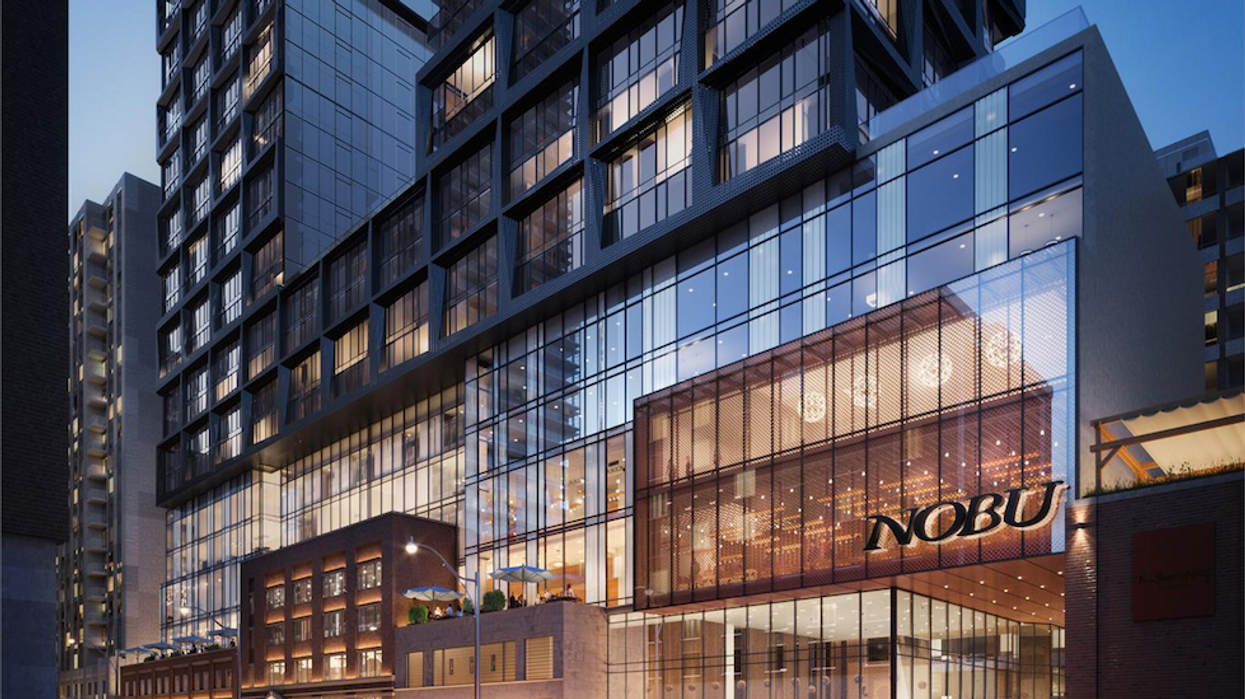
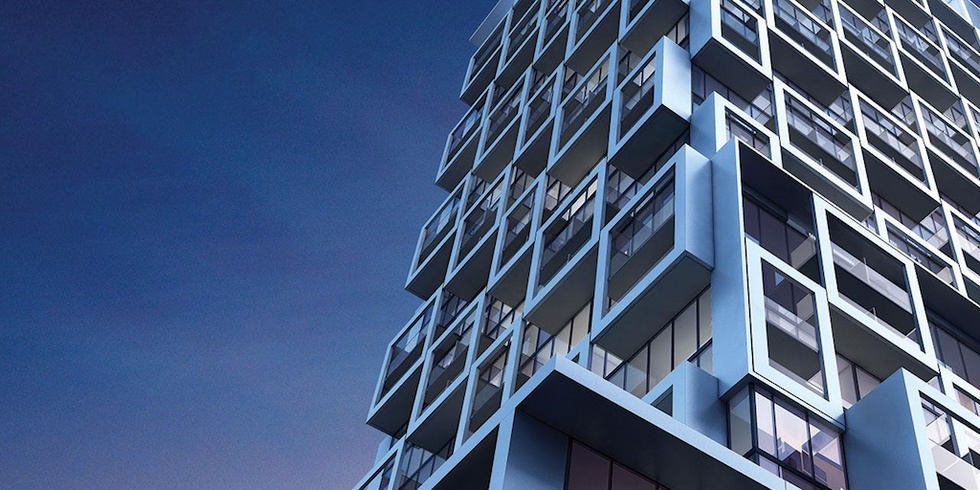
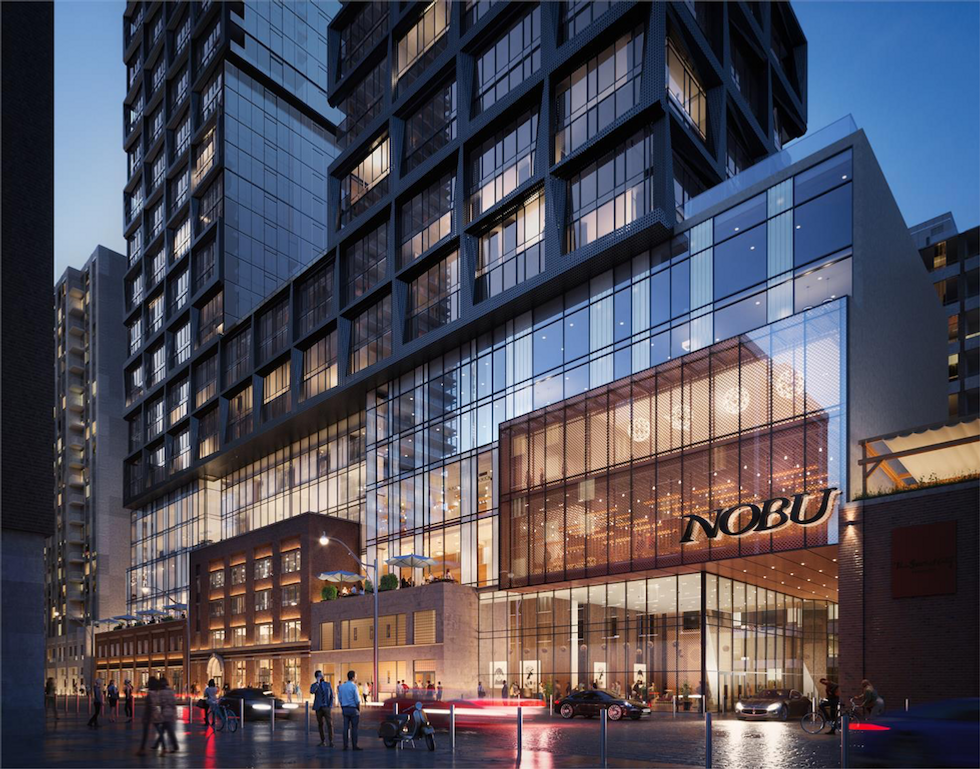 NOBU Condos
“It’s a really popular area, obviously. It’s sort of in the heart of downtown and a lot of tech companies have opened up here,” says Dawood, explaining the price gains in the Entertainment District.
“There’s quite a few new luxury products focused on the higher-end coming up in that area, and I think that’s really driving the growth there,” he adds, noting projects such as Nobu Residences by the Madison Group and Studio 2 from Aspen Ridge Homes.
High Park North
Average Q1 2018 list price: $627,490
Increase since Q1 2014: +36.55
Median price per square foot: $801
Increase since Q1 2014: +17.67%
Lawrence Heights
Average Q1 2018 list price: $429,531
Decrease since Q1 2014: -1.15
Median price per square foot: $793
Increase since Q1 2014: 62.32%
Lawrence Heights was the only entry where the average list price was lower in 2018 than it was in 2014, but Dawood explains the decline.
“The 2014 data was dominated by the first Treviso project, and I think they were advertising really big units.”
That’s one issue with looking solely at averages. The median price per square foot, he notes, is up considerably this year. “I wouldn’t characterize the area as stagnant at all.”
Old Town
Average Q1 2018 list price: $997,718
Increase since Q1 2014: +185.17%
Median Q1 2018 price per square foot: $1,100
Increase since Q1 2014: +100.59%
Prices increased the most in Old Town, and Dawood suggests it is a matter of the types of condos that were selling in 2014 and 2018, respectively.
“The pricing from 2014, based on Axiom Condos, is priced at a mid-end range, while the pricing for 2018 is based on East 55, a higher-end project.”
Liberty Village
Average Q1 2018 list price: $690,395
Increase since Q1 2014: +34.43
Median Q1 2018price per square foot: $912
Increase since Q1 2014: +66.27
Niagara
Average Q1 2018 list price: $732,464
Increase since Q1 2014: +45.89
Median price per square foot: $933
Increase since Q1 2014: +49.20
Stonegate-Queensway
Average Q1 2018 list price: $644,723
Increase since Q1 2014: +57.53%
Median Q1 2018 price per square foot: $784
Increase since Q1 2014: +46.57%
“I think the reality is there’s not that much construction space left in the downtown area, whereas Etobicoke is a lot more up and coming, so there’s tons of volume in Stonesgate-Queensway,” Dawood tells Storeys.
“It’s also a bigger neighbourhood geographically, so you expect some extra points.