
 (Photo courtesy of American Advisors Group via Flickr.com)
Despite slower year-over-year sales figures in the Toronto real estate market, sales in some Toronto neighbourhoods remain red-hot.
For instance, some listings last a week or less before being sold. Conversely, other neighbourhoods can see listings go un-sold for up to a month ... or more. Just look at these "unsellables."
This brings us to a key real estate metric: "Days on market."
Days on market (DoM) refers to the length of time a listing remains active on MLS before it is sold in a firm deal.
Generally speaking, shorter DoMs puts sellers in a position to price to their advantage because of strong competition. Longer DoMs indicate to buyers that there may be wiggle room during negotiations.
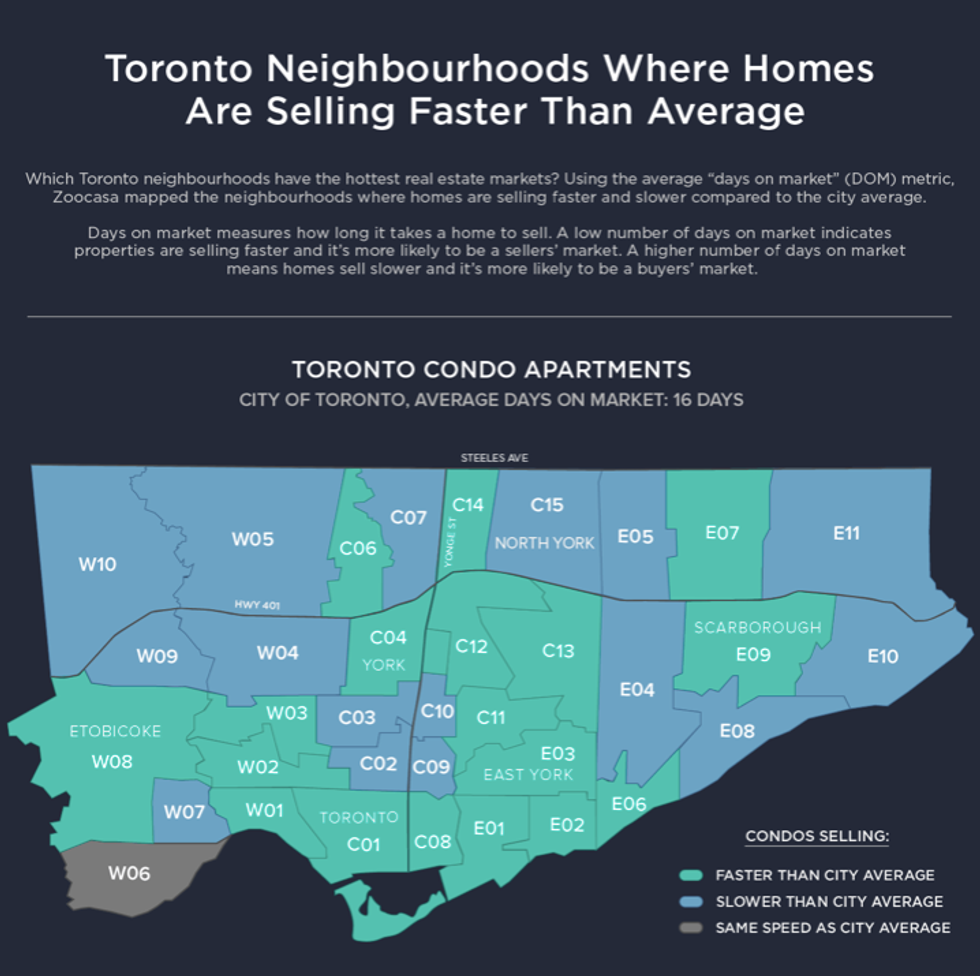
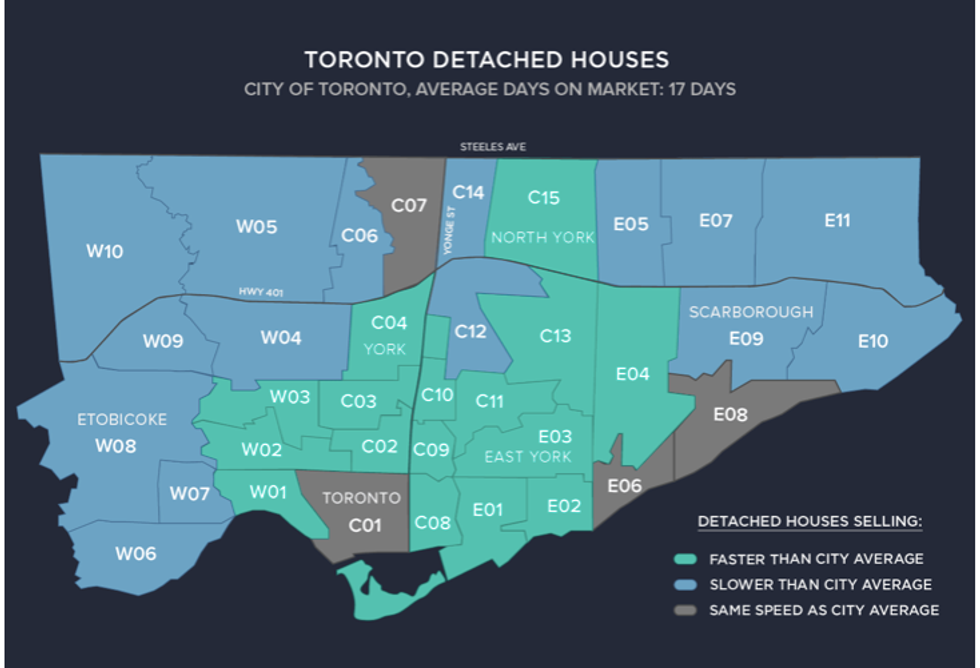
To identify the 416 neighbourhoods where homes (detached homes and condo apartments) move the fastest, Zoocasa compared each area to the city average, which was 16 days in April, according to data released by the Toronto Real Estate Board.
In the infographics below, Zoocasa's numbers reveal homes are moving at a slower pace compared to the same time last year.
On average, condos take 18 days to sell — that's eight days longer than in 2017. And detached homes require an additional 13 days than they did last — for a total of 22 DoM.
Of note, DoM can be so important that it's a common strategy for sellers of overlooked homes to pull their listing from the market to reassess marketing and pricing strategy.
Then, at a later date, the property will be relisted with a new MLS ID in hopes of attracting buyers with a seemingly fresh listing.
Fastest-Selling Toronto Neighbourhoods Compared To 2017
Condos
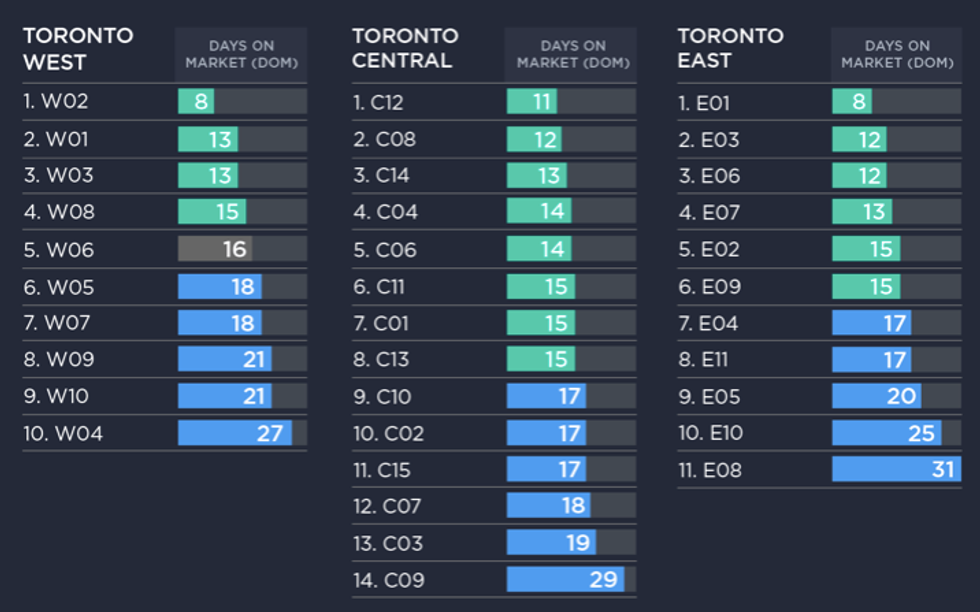
1: E06 – 12 DoM (-64%)
2: E02 – 15 DoM (-40%)
3: C02 – 17 DoM (-37%)
4: C04 – 14 DoM (-22%)
5: W03 – 13 DoM (-13%)
Detached Houses
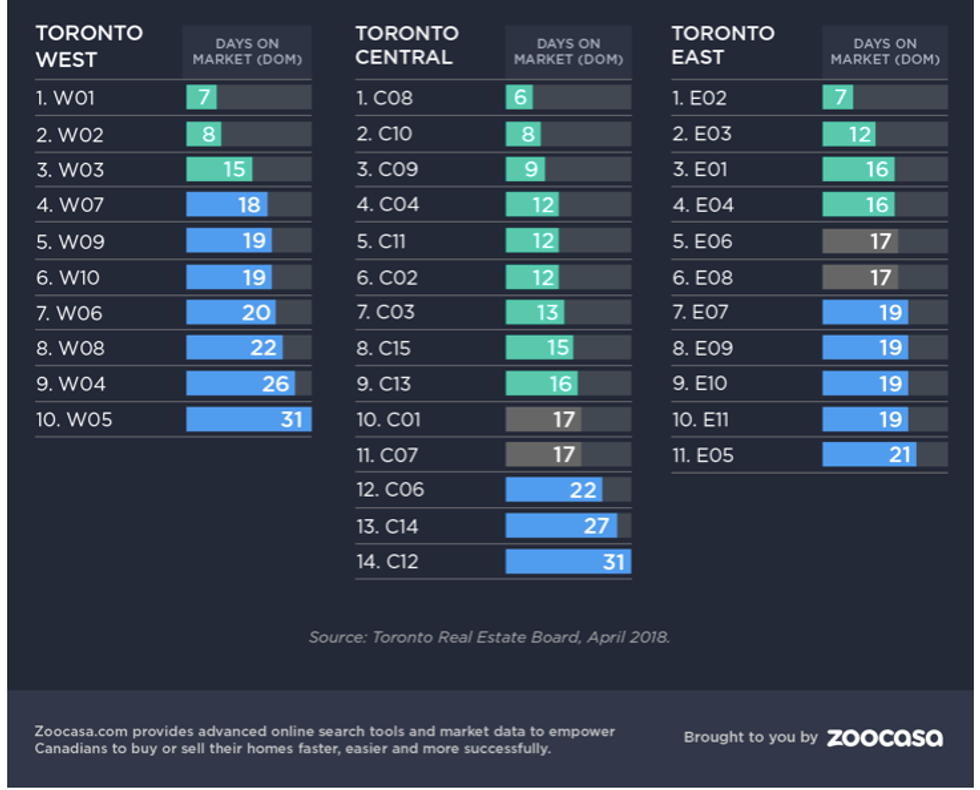
1: W01 – 7 DoM (-30%)
2: E02 – 7 DoM (-13%)
(TIE) 3: W02 – 8 Dom (0%)
(TIE) 3: C02 – 12 Dom (0%)
4: C04 – 12 DoM (9%)
5: C09 – 9 DoM (13%)
Slowest-Selling Toronto Neighbourhoods Compared To 2017
Condos
1: E08 – 31 DoM (+520%)
2: C03 – 19 DoM (+171%)
3: E05 – 20 DoM (+150%)
4: E10 – 25 DoM (+127%)
(TIE) 5: W04 – 27 DoM (+125%)
(TIE) 5: W07 – 18 DoM (+125%)
(TIE) 5: C07 – 18 DoM (+125%)
Detached Houses
1: W05 – 31 DoM (+288%)
2: W04 – 26 DoM (+271%)
3: C12 – 31 DoM (+210%)
(TIE) 4: C01 – 17 DoM (+183%)
(TIE) 4: E08 – 17 DoM (+183%)
5: C06 – 22 DoM (+175%)